Introduction, Aims and Learning Outcomes
The Boston Fingerprints Project: Enriching object biographies and tracing human-thing networks through analysis of digital 3D scans
The Parker-Harris Pottery Site and Three Cranes Tavern Site in Charlestown, Massachusetts, were excavated in the early- and mid-1980s in advance of Boston’s Big Dig as part of the Central Artery North Area and are now listed in the National Register of Historic Places as part of the City Square Archaeological District. The Parker-Harris Pottery Site was the location of early coarse earthenware (redware) ceramic production in Boston. It was destroyed on June 17, 1775 by British troops who burned Charlestown as part of the Battle of Bunker Hill. The Three Cranes Tavern was founded in the former Great House of Governor John Winthrop in the centre of Charlestown, only 100 meters from the Parker-Harris property. The tavern passed through a series of owners resulting in a near-continual use of the property as a tavern for 140 years. During archaeological investigation, numerous privies and features were identified with tightly-dated ceramic assemblages, including numerous coarse earthenwares with the distinct decorative elements of the Parker or Harris pottery. The Boston Fingerprints project, set up as a SPARC Collaboration in 2014 by Joseph Bagley and Jennifer Poulsen (Boston Landmarks Commission) and Rachel Opitz (SPARC researcher), aimed to use a structured light scanner to create detailed 3D models of ceramic artefacts featuring finger- and hand-prints, potentially enabling the team to directly connect pottery from consumption sites to production sites. The context, with known sales between production and consumption sites, tightly dated deposits that limit association of pottery to specific potters, and a limited number of potters producing these vessels, was an ideal opportunity to explore this approach to investigating previously-unknown associations and commercial networks of domestic redware potters across the eastern United States. The unique, personal fingerprints and handprints evoke the human connections represented in these significant assemblages, helping us to appreciate these forgotten and sometimes nameless potters through the intimate association of their hands.
In this lesson you will explore a collection of 3D models of ceramics with fingerprints and handprints and learn to:
-
Understand what metadata is, what kind of metadata is associated with 3D models, and how to use it to identify reusable 3D datasets that meet your project’s requirements;
-
Manipulate and visualise 3D data in MeshLab and CloudCompare – two open source software packages;
-
Interpret models visually, including identifying common errors in 3D data caused by data capture methodology or the material properties of the recorded object;
-
Carry out simple measurements and more complex quantitative analyses of 3D surface shapes in MeshLab and CloudCompare to investigate the lifeways of potsherds;
-
Integrate the skills developed in these Exercises, combining visual and metric analyses, to interpret 3D data to learn more about pottery manufacture at the Parker-Harris Pottery Site and the pottery’s subsequent use at the Three Cranes Tavern Site.
When you have completed this lesson you will be able to:
-
Identify 3D data suitable for research through familiarity with metadata conventions and methods of visualising 3D data;
-
Use both MeshLab and CloudCompare for 3D data visualisation and analysis;
-
Adapt and reuse existing datasets for use in quantitative analysis to make more robust, meaningful comparisons;
-
Understand the different, but complementary, insights provided by qualitative and quantitative methodologies and how the critical combination of these approaches contribute to stronger interpretations of archaeological evidence.
Outputs
Throughout these exercises, in boxes labelled as ‘Try it yourself!’ or ‘Reflect and Write’, you will be prompted to take a screenshot of your progress and add it to your ‘gallery’. Whether this gallery is simply a Word document where you have pasted the screenshot or something more is up to you. You will then be asked to reflect on the exercise and to summarise your reflections in a few sentences as a ‘long caption’ for your screenshot.
Research in the digital archives
What kinds of digital data are widely available in archaeological archives?
After an excavation, the archaeological archive consists of more than just physical boxes of artefacts and pages of excavation records in a storeroom. Much of the archive has gone digital; this can include photographs, spreadsheets listing contexts and their associated artefacts, word-processed reports, digitised maps and drawings, and, increasingly, three-dimensional (3D) models. Virtually anything can be recorded as a 3D model, whether it is a landscape, an excavation trench, a monument, or an artefact.
What is a 3D model?
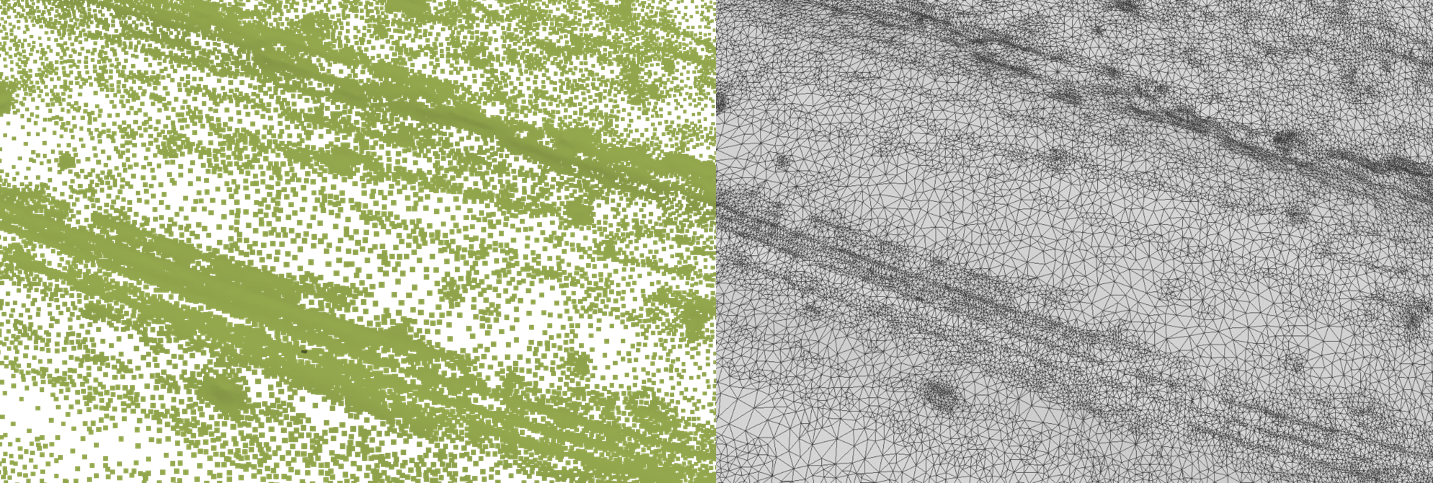
Essentially, a 3D model is made up of a point cloud (below left) and polygons generated between those points (below right). The point cloud is captured when the digital imaging technique measures and records the surface of an object as calculated points in three-dimensional space; each point is defined by a set of coordinates on the X, Y and Z planes. Triangular polygons are then generated between these points until a ‘solid’ mesh is created. If the colour of the recorded object is also captured by the digital imaging technique, this will be stored with the point cloud and transferred to the mesh. Depending on the technique used, it may also be possible to create a photorealistic texture, a flat image that can be ‘draped’ over the 3D model to give it a more realistic appearance. A texture can also be created independently and applied to a 3D model with no colour information. 3D models can be saved in a variety of file types, including .stl (stereolithography), .ply (Polygon File format, or Stanford File Format), or .obj (Wavefront Object, or just Object file), to name a few. If a 3D model has an associated texture, it will be saved as a separate image file, like a .tif or .jpg file, or an .mtl file (Material Template Library).
What kinds of questions can be addressed through the analysis of archived 3D models?
Because 3D models record the geometric surface of an object, 3D models are particularly well-suited to visual analysis. The option to ‘remove’ the colour from an object allows researchers to better observe and record the subtle creases and worn marks of the surface that might otherwise go unnoticed when viewing the real, physical object. 3D models also allow for different types of metric analysis. This might include anything from simple point-to-point measurements of length or width, calculations of surface roughness, or automated or repetitive measurements that would otherwise be impractical to measure from the physical object. A more comprehensive understanding of the archaeological material can be achieved by incorporating both visual and metric analyses in our interrogation of their digital 3D representations.
How to identify a reusable dataset that is appropriate to your research aim – A guide to metadata
What is metadata? – Metadata is information that describes other data. In this case, metadata is information that describes the 3D dataset. The basic metadata for a 3D model should, at a bare minimum, describe the file formats of the data, the creators of the data, when and how the data was created, and what is recorded in the dataset. Other types of information might be necessary, like whether the 3D model has been scaled or not, or a description of the archaeological context surrounding the artefact; these are addressed further below. Essentially, metadata should describe your dataset well enough that anyone can understand the dataset without further input/explanations from the creator. The metadata should accompany the dataset when it is archived, whether as a .txt file, a spreadsheet, or other word processed file.
Start with a Research Question – While it is always possible to explore an archive and see where your curiosity and chance discoveries take you, in this lesson we will focus on using archival data to address a specific research question: What new insights into the manufacturing processes and artefact lifeways can be achieved through visual and metric analyses of 3D models of the potsherds recovered from sites TC and PH? Having a clear research question in mind will allow you to identify and select appropriate data. What do we mean by ‘appropriate data’? There are several key considerations when choosing archival data to address a research question, which should be recorded in the dataset’s metadata:
-
How was the data captured – There are many different techniques that can be used to create a 3D model. Was it made with a structured light scanner, photogrammetry, or a laser scanner? Some digital recording methods may produce data better suited to your project than others. The brand and model details of the hardware and software used in creating the 3D model should be listed in the metadata so that future researchers can determine whether the data is suitable for reuse in their own research. It is also important to note whether any changes were made to the original dataset.
-
Resolution –What level of spatial detail do you need to answer your research question? Spatial resolution is usually measured as the smallest distance between points in the 3D model: the more points that are in the point cloud, the closer together the points are, and the more detailed the 3D model is. However, these denser point clouds will also produce larger file sizes, which take longer to work with. Also, you should note that data density is not the same as data ‘accuracy’.
-
Accuracy – While different companies will advertise the optimal ‘accuracy’ of their scanning technology, in practice it is difficult to put a number to the accuracy of 3D scans. Accuracy can be defined as a measure of how similar the 3D scan is to the original object. However, this can be affected by the calibration of the scanner or camera, or errors introduced by the individual recording the object. It is difficult to know if datasets produced by someone else are necessarily ‘accurate,’ especially if you do not have access to the physical object. To increase the reusability of a dataset, the method of capture, the environmental conditions during the recording session, and any problems encountered should be noted as metadata. If the digital imaging technique has an option to produce a document detailing its calibration, this should also be included in the metadata.
-
Scale – Usually structured light scanners will generally produce a 3D model scaled in millimetres, but 3D models created through other methods may not be automatically scaled. For example, with Structure-from-Motion photogrammetry, overlapping photographs are used to create a 3D model, but individual photos do not inherently contain information about the subject’s scale (i.e. a photo of an apple can be the same size as the photo of a building). It is up to the recorder to include scale bars or other means of measurement in the photographs, which they can then use to scale the 3D model during processing. It is necessary to make it clear what scale the 3D model is in through metadata, especially if it is to be reused for metric analyses.
-
Contextual information – The more information provided about the context of the find or site, the more useful the data can be for reuse in the future. For example, take a look at the metadata for this 3D model of a stone monument from Aberlemno. There are four early medieval carved stones from Aberlemno, but it is not clear from the information provided which stone this 3D model is representing. In fact, there is no background information on the physical object. This 3D model also has a low polygon count, so few of the carved features can be identified reliably. In addition to information on the site’s background, reference photos of the objects/sites recorded in 3D are key to understanding what is actually being seen, as you will find in the exercises below.
-
License – Ensure that you are able to use the data according to the terms of the license under which the data was published. There has a been a push towards open access by many funding bodies, but this will not be the case for all 3D data. Some licenses may not allow for commercialisation of a remix/reuse of the data – in the case of CC BY-SA (Attribution and ShareAlike), others are allowed to reuse the data for commercial or other pursuits, but the original authors need to be attributed, and the resultant data needs to be placed under an identical or a less restrictive license. CC0 is the most open of the licensing, as anything can be done with the data and the original author does not need to be attributed. See the definitions provided by Creative Commons to ensure you understand the terms of the different licensing options.
Datasets
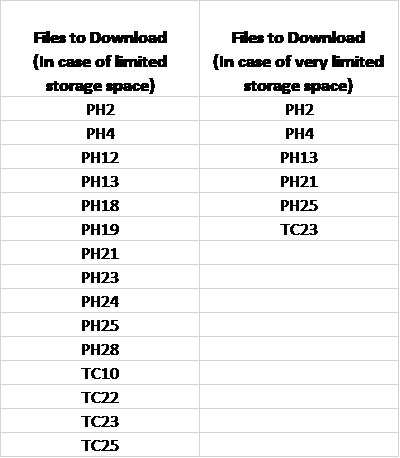
In this exercise we will be using Zenodo, an open access repository, to obtain our dataset. However, other repositories, like the Archaeology Data Service, will also have datasets freely available that may be useful in your future research. After navigating to Zenodo, search for ‘Boston Fingerprints 2014’, navigate to the entry for the Images, download the zip file, and extract the images to a new folder. These are reference images of the potsherds that have been 3D recorded and have been labelled to indicate the location of each of the identified fingerprints on the sherd. Next, navigate to the ‘Boston Fingerprints 2014 – Processed STL meshes’ entry. Please note that you will need 7.5 GB of space if you download all of the images and all of the processed STL files. If this is not possible, download the files recommended in the first column of the table below (1.12 GB total, including all Reference Images). If a smaller dataset is necessary, download the files recommended in the second column of the table below (540MB total. This includes only the 3D meshes discussed in the exercises; PH 25 is the largest of these (344MB total), but PH 25’s folder includes six .stl files: 5 individual scans, and 1 .stl where these five scans have been merged. After extracting PH 25’s data, one could delete all but the merged .stl and save 228 MB of space).
Note that PH25 and Note that PH30 may not unzip correctly from the main archive. These files are available individually from these links.
The Archaeological Context for the Data
As you can see in the contextual metadata for the Boston Fingerprints 2014 project on Zenodo, the pottery comes from two sites in Charlestown, Massachusetts: the Parker-Harris Pottery Site (PH) and the Three Cranes Tavern (TC). The sites were 100 metres apart; tightly dated ceramics assemblages were found at both sites, and it was clear that the Parker-Harris Pottery was supplying the tavern with coarse earthenware ceramics. The potsherds and trivets in this dataset were scanned because fingerprints and handprints were visible in their fabric; if the fingerprints could be matched between these sites and pinpointed to specific potters employed by the pottery, it not only provides a more direct connection to the historical person, but it could also contribute to identifying previously unknown commercial networks across the Eastern United States.
Software Installation
There are a number of open access software packages that allow for working with 3D data. For this exercise, Meshlab and CloudCompare will need to be installed to carry out the metric analyses described in the following steps. Download Meshlab from this link; there are options for Windows 64, MacOS, Linux AppImage and Linux Snap. The application itself does not take much space (125.1 MB space is required). It is worth noting that the computer’s graphics card may limit the size of the 3D models you can work with in Meshlab; however, the datasets from the Boston Fingerprints project should be small enough to not cause any issues. If you are using a laptop with a dedicated graphics card, follow the tutorial provided by the creators of Meshlab to ensure the software is using the correct graphics card. Download CloudCompare from this link; there are options for Windows 64, Mac OS 64 bits, and Linux 64 bits. 172.0MB of disk space will be required to install CloudCompare.
Please note that the keystrokes and shortcuts in this tutorial are for Windows, and those using Mac OS will need to identify alternative keystrokes.
To Exercise 1: Familiarising Yourself with 3D Data in Meshlab