Summer 2018 was a good season for cropmarks and air photos. As you may have heard, the unusually hot and dry weather stresses
out plants as they grow. When archaeological features are buried they can affect the growth rate of the crops above
them. The presence of features such as buried wall foundations or compacted floor surfaces produce a reduction in the
soil depth and lower moisture levels than the surrounding land. Crops immediately above these features tend to have
reduced growth rates in comparison to the plants above of no archaeological activity, producing “negative cropmarks”.
In contrast areas where ditches, pits and other features have been dug into the subsoil become filled over time.
This relative increase in soil depth and the potential to provide increased soil moisture enables the crops above to grow
higher and ripen later than the plants around them, producing “positive cropmarks”.
Both negative and positive cropmarks are more easily detected from the air and are usually visible during times of drought
when crops are at maximum stress.
LiDAR (Light Detection and Ranging) is a remote sensing
technique, used for high-resolution survey of landscapes.
The technology is based on the use of a laser scanner,
mounted on an aircraft. Laser scanners emit pulses of laser
light at a rate of many hundreds of pulses per second,
and measure the time it takes for the reflection of that
pulse to return to the instrument; a GPS is used to plot
the coordinates of each measurement. Using this method,
powerful computers are able to compute millions of
measurements in a dataset called a ‘point cloud’. In turn,
this point cloud is then used to make very detailed representations
of the ground surface, called ‘digital terrain
models’, often referred to as ‘DTMs’. (AOC Archaeology Group 2015, p.3)
Image copyright: Historic England
There are many ways to visualise lidar data to make it easier to see and recognise different types of features. You can learn about
some of the common visualisations in this presentation.
Raster lidar data visualizations for interpretation of microrelief structures dr. Žiga Kokalj ZRC SAZU Centre of Excellence for Space Sciences and Technologies.
In this exercise you will be visually interpreting both the air photo and lidar data to try and identify archaeological features.
Identifying and interpreting archaeological features takes practice and is a skill learned through experience. It is helpful to
look at examples of interpreted data as you develop this skills.
Want to learn even more? Start with these readings.
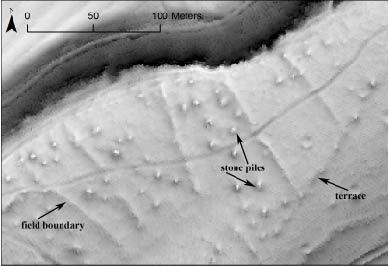
In this map you see an air photo ('AP') layer that shows an air photo of part of Iona. Air Photos are generally quite good at showing cropmarks (stressed crops as discussed above) which appear as differences in the colour of the vegetation. They can also show changes in the topography, that is the shape of the ground, through shadows cast by features like banks or mounds.
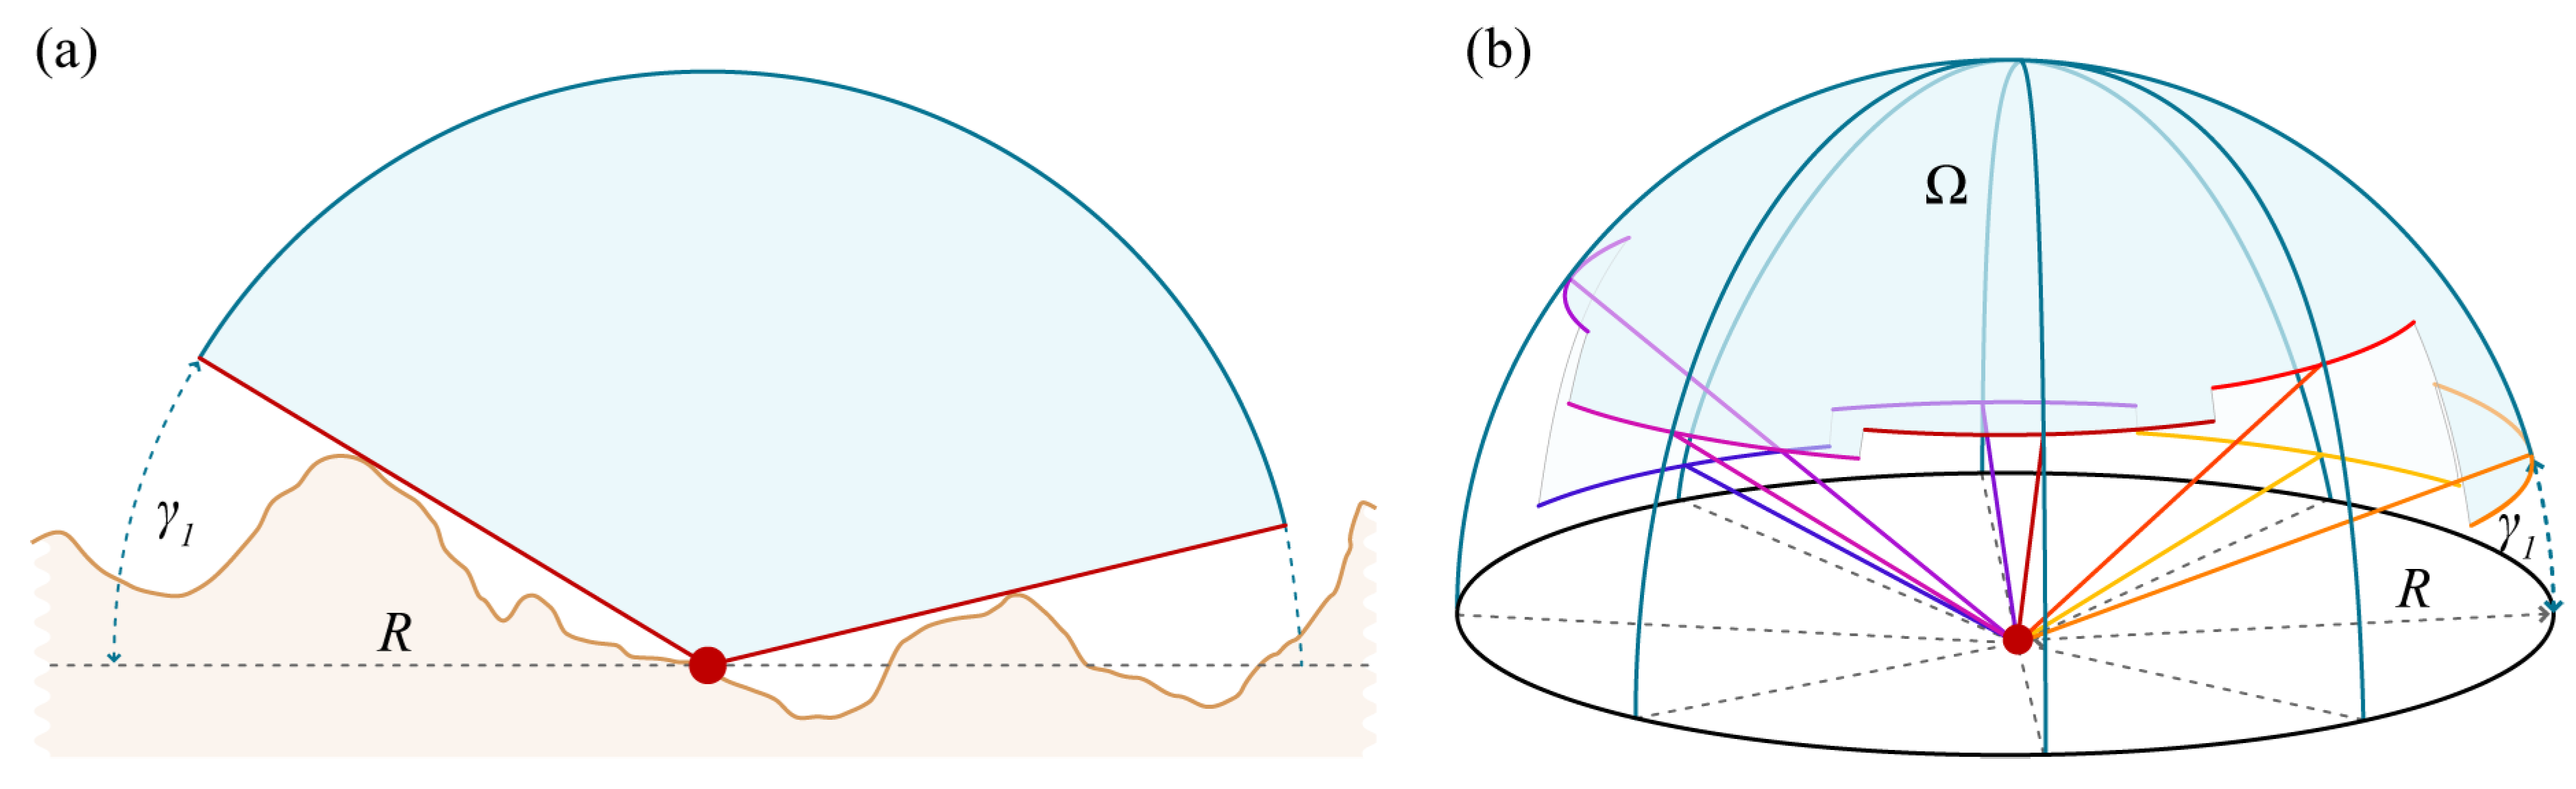
You'll also see a sky view factor visualisastion ('SVF') layer. This visualisation represents the amount of sky you could see if you were laying down (on your back) at each point in the landscape. If you're somewhere quite sheltered, say the bottom of a ditch, you don't see much of the sky. These less visible positions are represented as being darker. If you're laying on top of a hill, you can see the sky all around. These positions with great views are represented as being quite light (white). These visualisations are very good at highlighting upstanding architecture and bumps on the landscape, which will be white, and things like ditches and pits, which will appear black.
A schematic representation of how the sky view factor is calcuated. Image copyright: Ziga Kokalj ZRC SAZU.
This visualisation was created using a DTM that was made using airborne lidar data. Both images are quite detailed. Individual pixels in them are roughly 20cm on each side.
Exercise Instructions
Archaeologists often use aerial images like these to try and identify and interpret archaeological features in the landscape.
Use the tools on the left side of the screen to draw archaeological features you think you see. You'll probably want to zoom quite a bit.
You'll notice as you draw using the line tool that the length of the features is noted in meters. Pay attention to the size of your features when making interpretations!
Think about what size a house is, or how wide a road is and consider this when identifying potetial archaeological features.
You may want to switch back and forth between layers using the control in the upper right corner.
Once you have drawn all the archaeological features you think you recognize, save your work by capturing the screen.
Consider the Following questions:
Are there features you can see in the lidar visualisation but not air photo, and vice versa?
How confident do you feel about each interpretation? Could you rank your confidence on a scale of 1 (totally confident) to 5 (quite doubtful)?
What kinds of features do you think you have identified? Buildings? Roads? Fields?
What might these features look like walking around them on the ground? Do you think you would recognize them easily?
What kinds of things would be invisible in images and data like these? Would it be possible to see individual objects, for example?